Self-Sustained Oscillations of Shallow Flow Past Sequential Cavities
Submitted by bat310 on Wed, 2014-02-26 18:19
Shallow flow past successive cavities is characterized via a technique of high-image-density particle image velocimetry. Highly coherent, self-sustained oscillations arise due to coupling between: the inherent instability of the separated shear layer along the opening of each sequential cavity; and a gravity standing wave mode within each cavity. The globally coupled nature of the flow structure is evident in dominance of the same spectral component in the undulating vorticity layers along each of the successive cavities and the wall pressure fluctuations within the cavities. Unlike coupled phenomena associated with flow past single cavities, optimal coupling for successive cavities requires a defined phase shift between the standing wave patterns in adjacent cavities and, furthermore, an overall phase shift of the undulating shear layer along the cavity openings. The magnitudes of these phase shifts depend on the mode of the gravity standing wave in each cavity, i.e., longitudinal or transverse mode, which are respectively aligned with and normal to the main stream. Such phase shifts result in corresponding displacements of patterns of phase-referenced vorticity concentrations along the cavity openings and change in timing of impingement of these concentrations upon the downstream corners of successive cavities. All of the foregoing aspects are related to the unsteady recirculation flow within the cavity, the time-dependent streamline topology, and concentrations of Reynolds stress along the cavity opening.
Principal Investigator: B. A. Tuna
The main goal of this investigation was to determine the flow structure along and within two successive cavities. A test-section insert was designed and constructed to allow the control of the water depth, the dimensions of cavities, and the flow velocity. Detailed schematics of the experimental system are given in Figure 1. For all experiments described herein, each cavity had a length of L = 152 mm and a width of W = 228 mm. The nominal water level was adjusted to a value of hw = 38 mm, and the width of the channel was We = 470 mm as shown in Figure 1. PCB piezoelectric pressure transducers were employed for unsteady pressure measurements at five different locations p1-5 as shown in Figure 1. They were used to determine the phase shift between the oscillations in adjacent cavities.
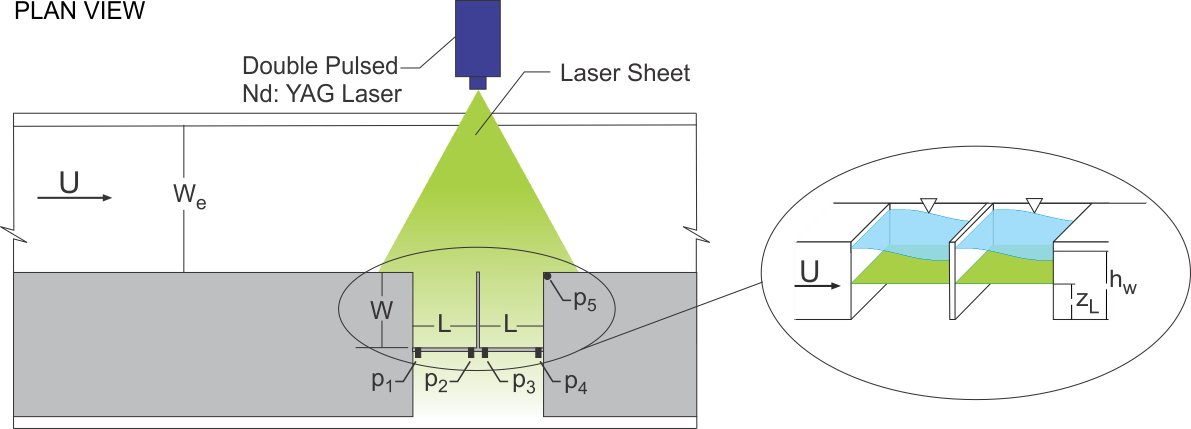
Figure 1. Schematics of experimental test section and quantitative imaging system.
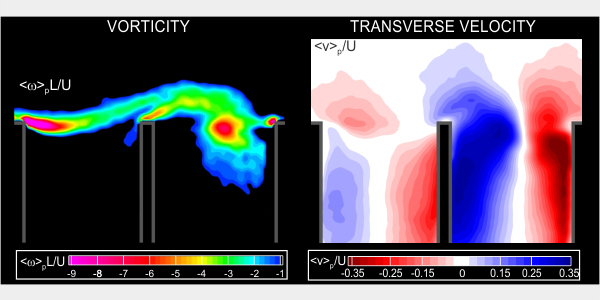
Figure 2 provides time-averaged representations of the flow structure. In Figure 2a, contours of time-averaged vorticity indicate a wide extent of <w>L/U, in presence of the transverse mode of the gravity standing wave. Moreover, when the longitudinal (streamwise-oriented) gravity standing wave exists, as shown in Figure 2b, the width of the vorticity layer <w>L/U is substantially diminished. The rate of attenuation of high levels of <w>L/U in the streamwise direction is also of interest. For the longitudinal mode of the standing wave, the (yellow) region that indicates a high level of vorticity <w>L/U extends well downstream towards the impingement region of each cavity. On the other hand, for the transverse mode of the gravity standing wave, the high levels (yellow colors) of <w>L/U are rapidly attenuated in the streamwise direction.
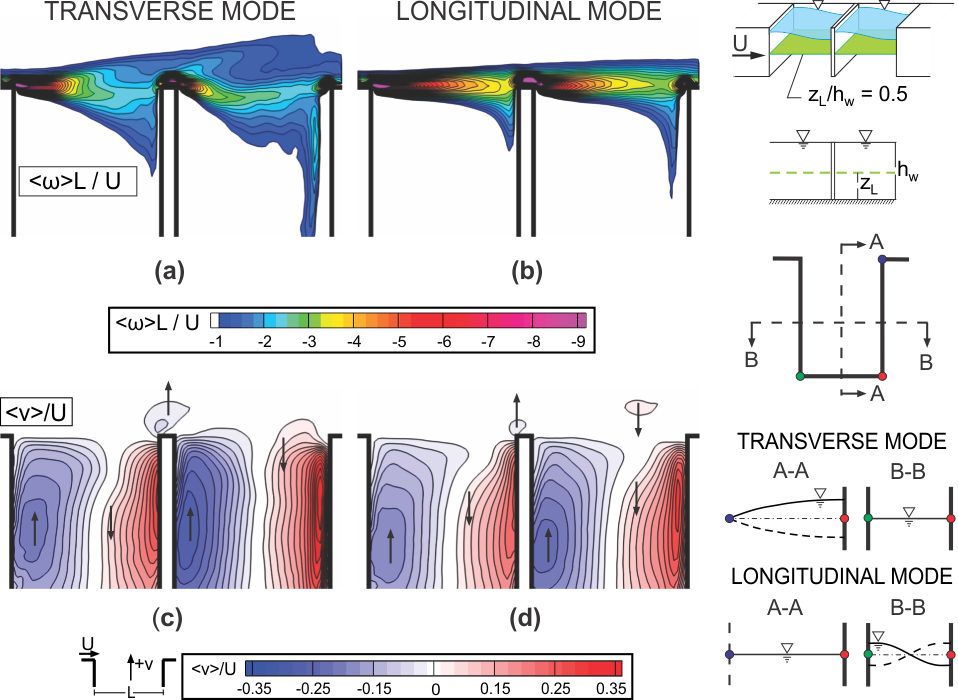
Figure 2. Contours of time-averaged vorticity <w>L/U (a, b) and transverse velocity <v>/U (c, d) for transverse and longitudinal modes of gravity standing waves within the cavities, are represented respectively by images in left and right columns.
Figures 2c and 2d show contours of constant time-averaged transverse velocity <v>/U. Blue contours indicate outward-oriented transverse flow, i.e., flow towards the opening of the cavity, and red contours indicate inward-oriented flow, that is, into the cavity. Larger magnitude, outward-oriented (dark blue) flow and inward-oriented (dark red) flow occurs for the transverse mode (Figure 2c), relative to the longitudinal mode (Figure 2d), thereby signifying enhanced recirculation flow within the cavity for the transverse mode.

Figure 3. Contours of phase-averaged vorticity <w>pL/U, for transverse and longitudinal modes of gravity standing waves within the cavities, are represented respectively by images in left and right columns.
Figure 3 shows patterns of phase-averaged vorticity <w>pL/U for the transverse and longitudinal modes of the gravity standing waves. By comparison of images at a given phase, it is possible to determine common features of the vortical structures in the separated shear layers. Clusters of phase-averaged vorticity are labeled as A, B, C, and D. In Figure 3 (left column), at 0°, the clusters of <w>pL/U in the leading and trailing cavities are labeled as A and B. Similar clusters of vorticity can be identified at 180°; however, cluster B is in the leading cavity and cluster A is in the trailing cavity as a result of pi phase shift between the gravity standing waves in the leading and trailing cavities. A similar comparison can be done at the oscillation phases of 90° and 270°; where clusters of phase-averaged vorticity are labeled as C and D. On the other hand, in Figure 3 (right column) , like clusters of vorticity occur at different phases. At 180°, the vorticity cluster along the leading cavity is labeled as C. A similar cluster C is evident along the trailing cavity at 270°, due, of course, to the pi/2 phase shift between leading and trailing cavities. This phase shift can also be seen by comparing clusters of vorticity A, B, and D at different phase angles of the oscillation.