Self-Sustained Oscillations Due to Turbulent Shear Flow Past a Slotted Plate
Submitted by lcr217 on Thu, 2013-10-10 11:38
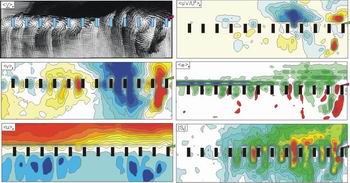
Self-Sustained Oscillations Due to Turbulent Shear Flow Past a Slotted Plate. The coherent unsteadiness arising from shear flow past a slotted plate are represented by phase-averaged and time-averaged images of flow structure. The pattern of phase-averaged velocity <V>p shown in the image at the upper left indicates a large-scale swirl pattern immediately upstream of the trailing-end of the plate. Furthermore, on the left side of this image, the first stage of development of the successor to this large-scale swirl is evident. Contours of constant vertical velocity <v>p in the second image, at the same instant as the pattern of the total velocity <V>p in the first image, show regions of downward (red and yellow) and upward (blue and purple) velocities. At this particular instant, a pronounced, downward-oriented jet is evident in the last slot at the trailing-end of the plate, while a region of pronounced, upward-oriented jets is evident in the third and fourth slots upstream of the trailing-end. Furthermore, upstream of this region, i.e., over the left half of the slotted plate, the first stages of development of the successor swirl pattern are indicated by the region of downward-oriented flows through the slots. The corresponding image of phase-averaged streamwise velocity <u>p shows a wave-like pattern along the upper side of the plate and coherent clusters of negative (blue and purple) streamwise velocity beneath the plate. These clusters are associated with the ordered, pulsating flow through each of the individual slots; note that their wavelength is approximately equal to the pitch of the slot configuration.
In the second column of images, the pattern of phase-averaged Reynolds stress correlation, indicates large amplitude negative (red and yellow) and positive (purple and blue) clusters along the upper surface of the plate and, furthermore, a large magnitude negative cluster beneath the slotted plate associated with the downward-oriented jet flow. All of the features of the aforementioned velocity components and their correlation are associated with the pattern of phase-averaged vorticity <ω>p at the same instant in the oscillation cycle as the foregoing images. Clusters of green indicate clockwise vorticity. Note that the major vorticity cluster is along the upper surface of the plate and its position is in accord with the large-scale swirl pattern of <V>p shown in the first image. The downward-oriented jet flow through the last slot is associated with both negative and positive concentrations of vorticity. Furthermore, in many of the additional slots, regions of opposite-sign, counter vorticity, designated in red, are clearly evident.
Finally, as shown in the last image, the time-averaged magnitude of the transverse velocity fluctuation is represented by the magnitude of the spectral peak |Sv|. This spectral peak magnitude was evaluated at 7200 locations over the entire plane of the flow using a technique of space-time imaging. The indicated contours were constructed from this large number of spectra. Particularly large magnitudes are evident in the region immediately above the slotted plate, as well as within individual slots, at least over the right half of the plate.
Album:
Vortex Evolution along Perforated Plates