Attenuation of Oscillations of Shallow Flow Past a Cavity
Submitted by bat310 on Wed, 2014-02-26 17:49
Fully turbulent shallow flow past a cavity can give rise to highly coherent oscillations, which arise from coupling between the inherent instability of the separated shear layer along the cavity opening and a gravity standing wave within the cavity. The objective of the present investigation is to attenuate these oscillations by a single geometric perturbation (cylinder) on the bed (bottom surface), which is located near the leading corner of the cavity. The patterns of the flow structure are characterized as a function of height of the cylinder above the bed by using digital particle image velocimetry. Reduced amplitude of the coupled oscillation can be attained for values of cylinder diameter and height nearly an order of magnitude smaller than the water depth. The reduction of oscillation amplitude is associated with an increased width of the separated shear layer along the opening of the cavity, even at elevations above the bed much larger than the height of the cylinder. Near the bed, a vorticity defect in the separated shear layer and deflection of the layer away from the cavity opening are evident. The attenuation of the oscillation amplitude is associated with: a major decrease in the peak values of the normal and shear Reynolds stresses in the separated shear layer; degradation of coherent, phase-averaged patterns of vortex formation; and decreased scale of the coherent vortical structures that propagate downstream along the cavity opening. These changes in the stresses and the flow structure are, in turn, directly correlated with lower values of exchange velocity along the opening of the cavity, which is due to the decreased entrainment demand of the separated shear layer. This decrease in magnitude of the exchange velocity in the presence of the cylinder results in a 50% reduction of the value of mass exchange coefficient between the cavity and the mainstream.
Principal Investigator: B. A. Tuna
Detailed schematics of the experimental system are given in Figure 1. In order to obtain a fully-coupled state of the oscillation, the cavity width W, the cavity length L and the water depth hw were varied during diagnostic experiments. To determine the conditions for optimal attenuation, the cylinder diameter d, the gap e between the cylinder and the upstream wall, and the height of the cylinder hc were also varied. For all experiments herein, as defined in Figure 1, the cavity had a length of L = 305 mm, a width of W = 457 mm. The water level was adjusted to a value of hw = 38.1 mm. The diameter of the cylinder located at the leading edge of the cavity was d = 6.35 mm, and the gap between the cylinder and upstream corner of the cavity was e=6.35 mm. Two different cylinders were placed at the leading edge of the cavity; they had heights of hc = 3.175 mm and 6.35 mm.
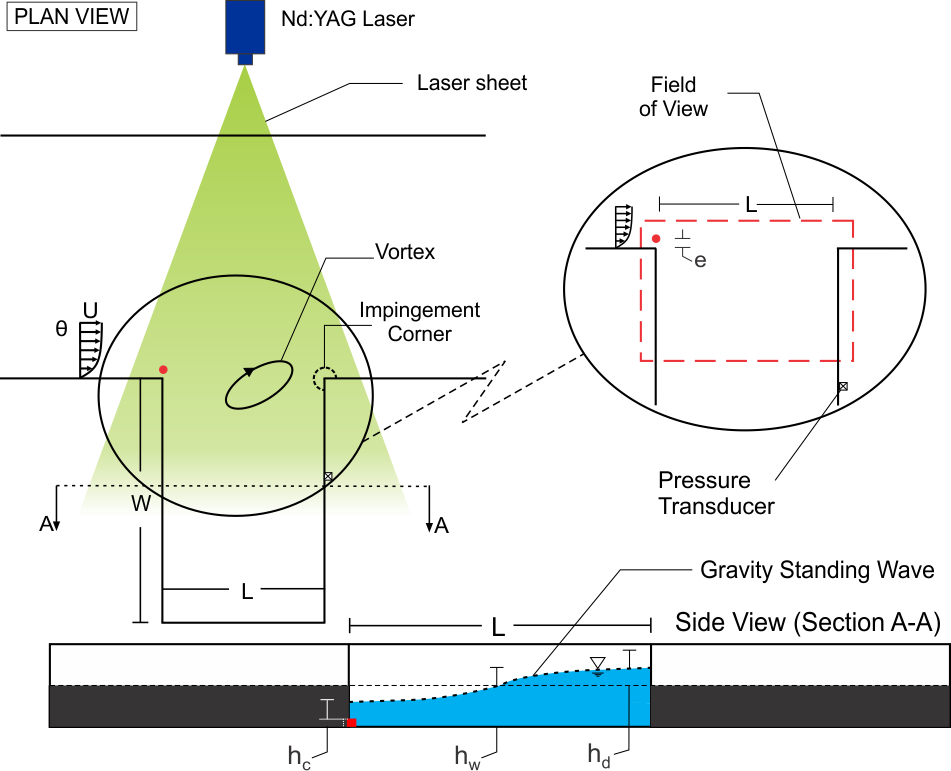
Figure 1. Schematics of experimental test section and quantitative imaging system. Also illustrated are representations of unstable shear layer along opening of the cavity and deformation of free-surface due to presence of gravity standing wave. (not to scale)
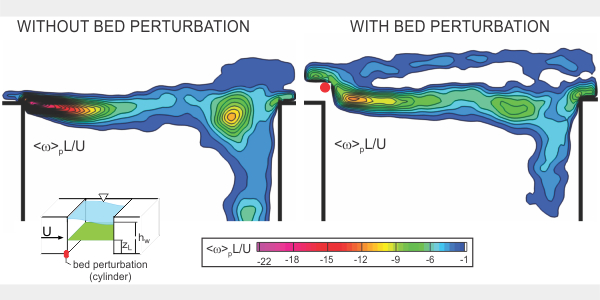
Figure 2 provides time-averaged contours of constant vorticity <w>L/Ur in the top row and transverse velocity <v>/Ur in the bottom row. The left column of images corresponds to the maximum-amplitude of the gravity standing wave, and the right column represents the case in presence of cylinder. The high level (green color) vorticity <w>L/Ur is rapidly attenuated in the streamwise direction in absence of the cylinder, and in presence of the cylinder, this region progressively extends downstream and eventually intersects the impingement corner. This streamwise degradation of high level vorticity is related to the large-amplitude transverse undulations of the vorticity layer. A further feature of the images of vorticity contours is a distinct, narrow band of vorticity in presence of the cylinder; it extends from the cylinder to the downstream corner of the cavity. This vorticity band occurs in conjunction with the region of transverse velocity oriented away from the cavity.
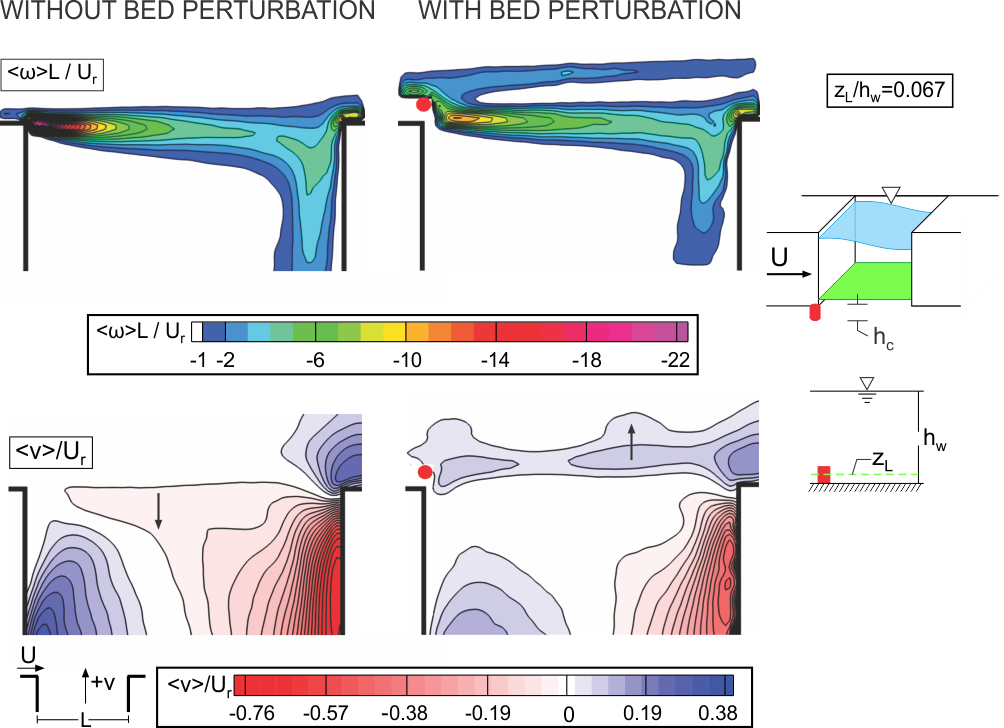
Figure 2. Contours of time-averaged vorticity <w>L/Ur (top row) and transverse velocity <v>/Ur (bottom row) for cases with (right column) and without (left column) the cylinder.
The bottom row of Figure 2 shows time-averaged patterns of transverse velocity <v>/Ur. Blue contours indicate outward-oriented transverse flow, i.e., flow away from the interior of the cavity, and red contours indicate inward-oriented flow, that is, towards or into the cavity. In absence of cylinder, large magnitude, outward-oriented (dark blue) flow moves towards the mouth of the cavity and inward-oriented (dark red) flow occurs into the cavity; this image correspond to the fully-coupled (locked-in) oscillation. The peak magnitude of both the inward-oriented and outward-oriented flow decreases in presence of the cylinder, as indicated in the right column. One can therefore conclude that the presence of a cylinder at the leading edge of the cavity results in a substantial decrease in the strength of the recirculation flow within the cavity. Furthermore, a distinctive feature of the images of transverse velocity, in presence of the cylinder, is a region of outward (blue color) transverse velocity located downstream of the cylinder.
Phase-averaged streamline patterns are given in the first row in Figure 3. The left column of images corresponds to the maximum-amplitude of the gravity standing wave, and the right column represents the case in presence of cylinder. The patterns of recirculating streamlines within the cavity show notable distortions. Deflection of the streamlines away from the cavity in the presence of the cylinder (bed perturbation) occurs. The deflection of shear layer was also indicated in the computational study of Arunajatesan et al. (2002). In addition, a downward directed jet-like flow occurs adjacent to the trailing (impingement) corner of the cavity.
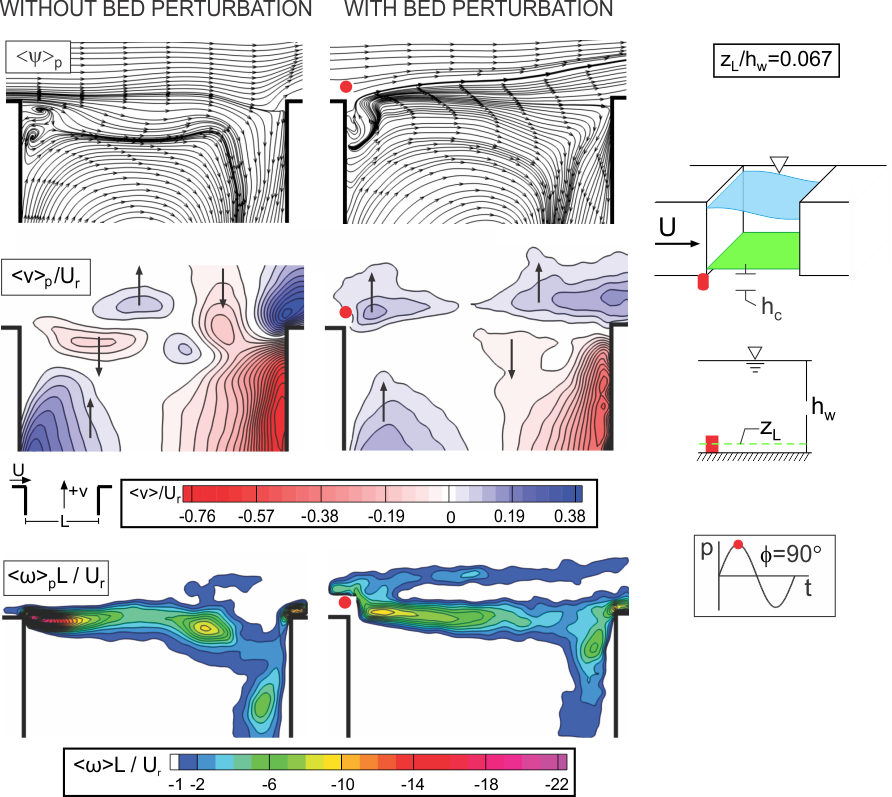
Figure 3. Patterns of phase-averaged streamline (top row), transverse velocity <v>p/Ur (middle row), and vorticity <w>pL/Ur (bottom row) for cases with (right column) and without (left column) the cylinder.
The second row in Figure 3 shows corresponding contours of constant phase-averaged transverse velocity <v>p/Ur. Red contours of <v>p/Ur indicate flow in the inward direction (negative y direction) towards the interior of the cavity, and blue contours of <v>p/Ur indicate the flow in the outward direction (positive y direction) away from the cavity. In the left column, red and blue clusters of transverse velocity propagate downstream along the cavity opening. These downstream-propagating clusters are barely detectable in presence of the cylinder (right column). This phenomenon can be related to the loss in the coherence of the large-scale vortex formation in the shear layer along the cavity opening due to the effect of the bed perturbation (cylinder). Furthermore, high levels of outward-oriented (blue) clusters of phase-averaged transverse velocity <v>p/Ur are located downstream of the cylinder as indicated in the right column. Within the cavity, it is evident that the magnitudes of both the inward-oriented (red) and outward-oriented (blue) transverse velocity <v>p/Ur within the cavity are reduced in presence of the cylinder.
Phase-averaged contours of constant vorticity <w>pL/Ur are shown in the last row in Figure 3. Onset and development of a large-scale vortical structure is present in absence of the cylinder (left column). Furthermore, the scale of the cluster of vorticity that is deflected into the cavity at the trailing edge is relatively larger in magnitude (green contour level) in the absence of the control cylinder compared to case with the control cylinder. A further point is that a distinct narrow band of vorticity is detectable in the phase-averaged patterns of vorticity <w>pL/Ur; this band of vorticity is not detectable in absence of the cylinder (left column).
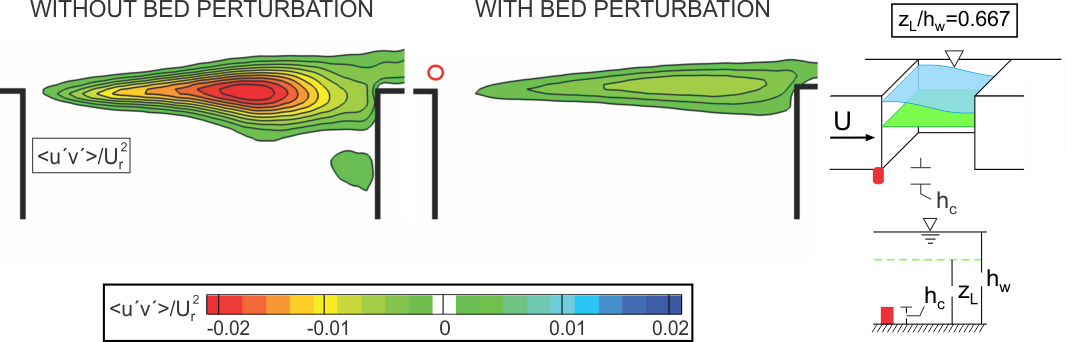
Figure 4. Patterns of Reynolds stress <u′v′>/Ur2 for cases with (right column) and without (left column) the cylinder.
Patterns of Reynolds stress <u′v′>/Ur2, that is the degree of correlation between the streamwise u′ and transverse v′ velocity fluctuations, are shown in Figure 4. The peak values of Reynolds stress <u′v′>/Ur2 in absence of the cylinder, shown in the left column, are significantly attenuated in the presence of the cylinder, as evident in the right column. The magnitude of the Reynolds stress in the separated shear layer along the cavity opening is directly related to the entrainment demand of the separated layer and thereby is expected to influence the mass exchange process between the cavity and main stream.